Why Figures Matter: Seeing Learning Through Data
- Tamara Giusti
- Dec 3, 2025
- 2 min read
As teachers, we gather incredible amounts of information—exit tickets, observations, checklists, writing samples, reading notes, project reflections, and informal check-ins. But sometimes it isn’t until I visualize the data that the learning patterns become clear.
Figures (like bar graphs, tables, and charts) turn scattered information into something we can see, interpret, and act on. They help me answer questions like:
Who’s ready for enrichment?
Who needs reteaching?
Where is the class as a whole?
Is my instruction working?
A figure isn’t just a picture; it is a story about learning.
Why Visuals Matter in Assessment
Research supports the use of figures and visuals in assessment because they:
highlight trends we might overlook in narrative notes,
make instructional decisions clearer,
support more objective conversations with families,
increase transparency for students,
and help teachers monitor progress toward mastery more accurately.
Graphs and tables also support student self-awareness: when students see their growth plotted visually, their understanding of their own learning deepens.
Figures Support a Balanced Assessment System
In a balanced system, figures help us:
document student performance over time,
compare performance across subgroups or skills,
identify learning gaps quickly,
track growth after instructional adjustments, and
communicate progress clearly to students and families.
For me, visuals often guide the “What next?” moment of planning.
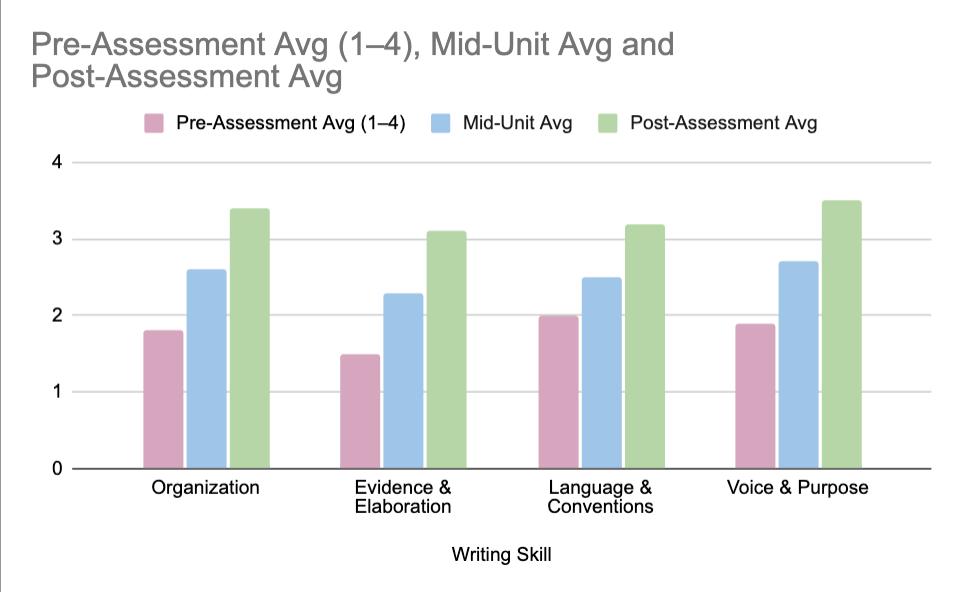
How a Figure Like This Guides Instruction
Seeing the data visually helps you:
notice which writing skills grew fastest,
identify areas needing reteaching (often conventions or evidence),
celebrate growth with the class,
reflect on which instructional moves worked best, and
plan next steps—small groups, mini-lessons, or additional modeling.
Figures bring clarity. They turn assessment into action.
How Students Benefit
Students love seeing their learning “mapped.” Visuals help them:
take ownership of their data,
set personal goals (“I want to raise my evidence score”),
understand mastery as a process, and
reflect more deeply on their work.
Figures transform assessment from something done to them into something they understand and use.
My Guiding Belief
When we visualize learning, we make it visible.And when learning becomes visible, it becomes actionable—for teachers and students.
A simple bar graph can do more than summarize data.It can spark reflection.It can inform instruction.It can motivate students.It can tell the story of growth.
References
Waggett, R. J., Johnston, P., & Jones, L. B. (2020). Beyond simple participation: Providing a reliable informal assessment tool of student engagement for teachers. Journal of Science Teacher Education, 31(7), 737–757.
Comments